In this post we describe Dragnet, our approach to content extraction. This continues our series of deep dives on individual pieces of Fresh Web Explorer (see a description of Fresh Web’s overall architecture and of Feed Authority).
The goal of content extraction (CE) or de-chroming is to separate the main content of a web page (title, article text, comments, etc.) from the navigation chrome (headers, side bars, footers, ads, etc). In our case, we use it as a filtering step before indexing each document. For more details beyond this post, see our paper (to be published at WWW 2013), or check out the source code on Github.
The main idea in our approach is to use a set of diverse features in an ensemble-like machine model.
Following [1], we begin by splitting each web page into a sequence of “blocks”
using the DOM and a specified set of tags that modify the on screen layout (e.g.
div, p, h1, etc). We iterate through the DOM tree and create a new block each time one of these tags is encountered. Then, for each block we construct a set of features and use them in a classifier to predict block level content/no-content.
We will use the following web page as a case study to illustrate the different types of features in our model.
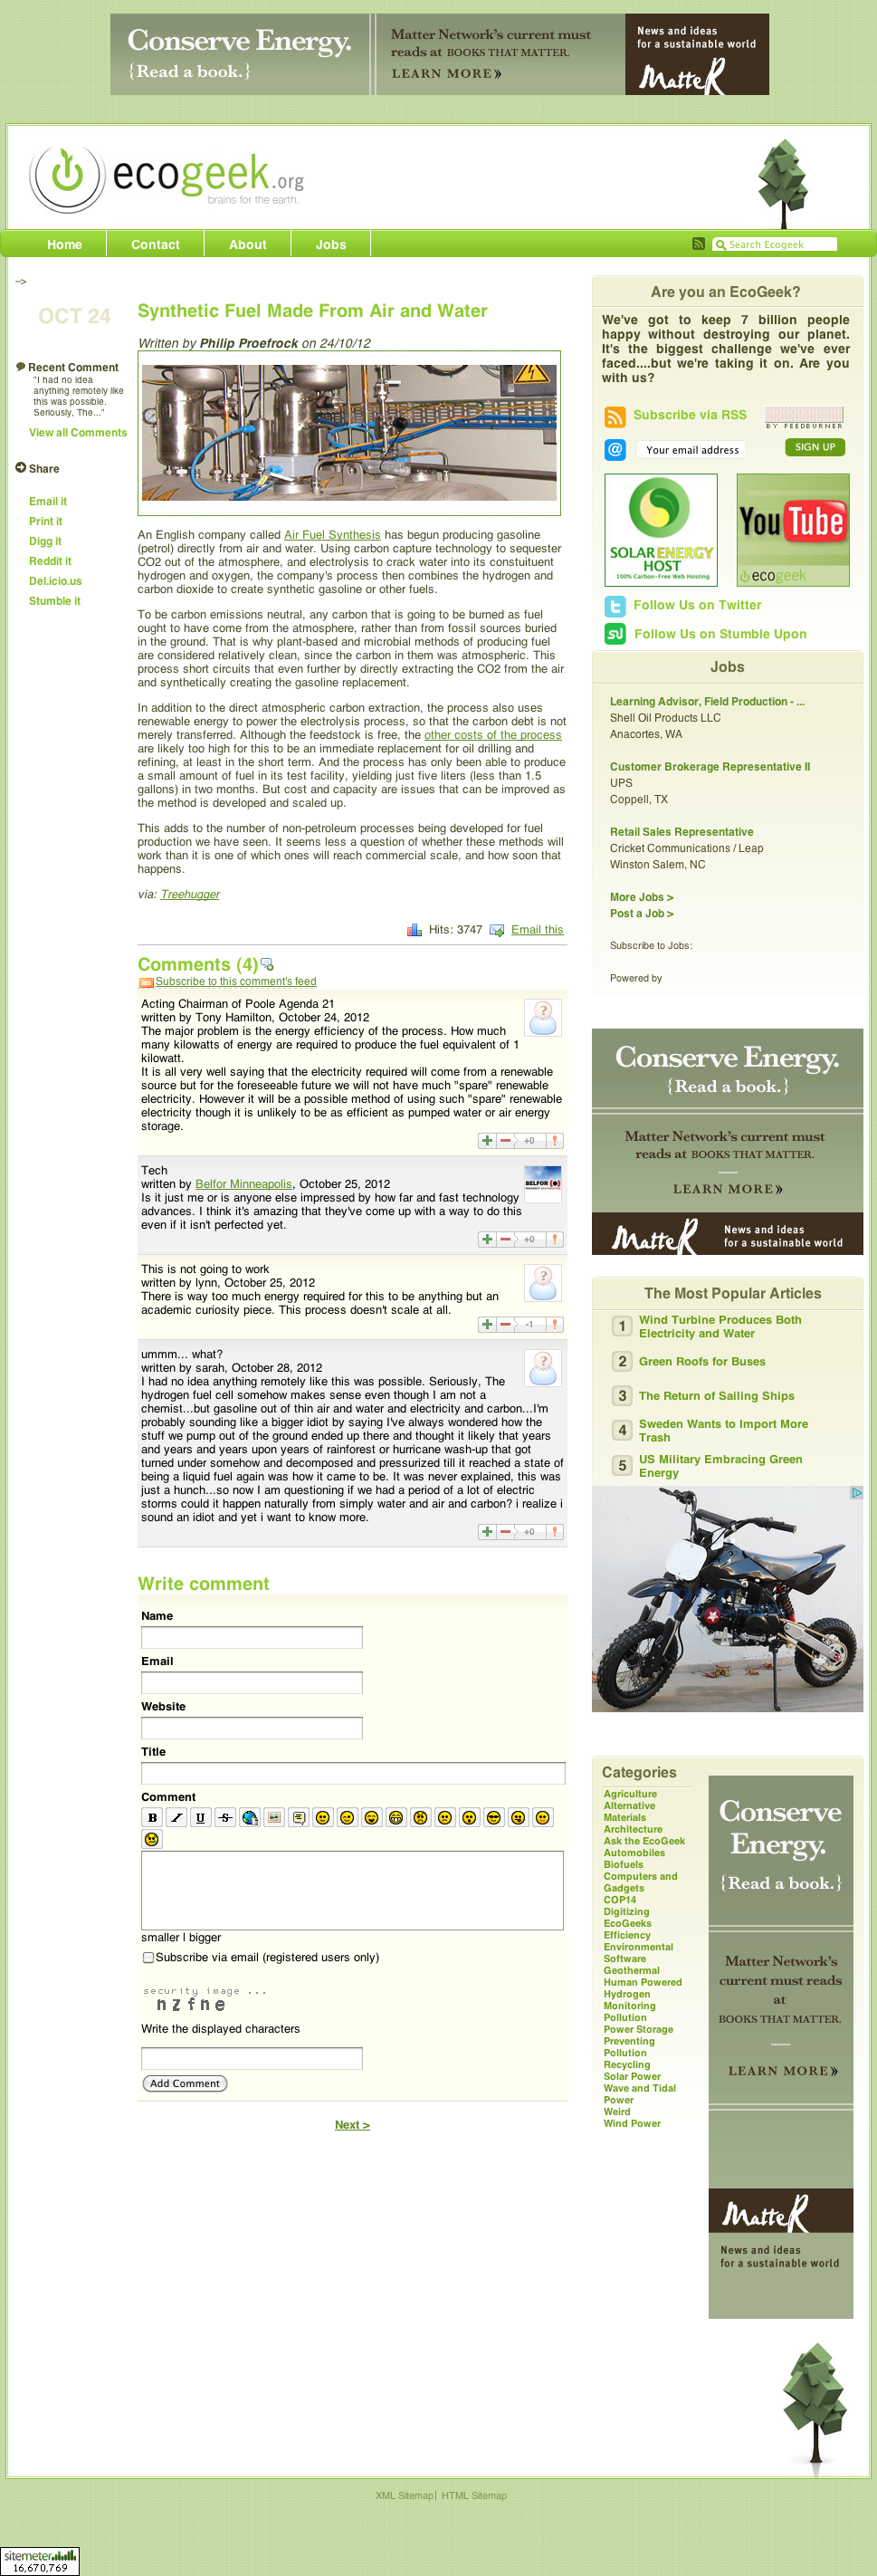
This is a blog with a fairly typical layout: a section of main article content, followed by four user generated comments. For our purposes, we consider comments to be content and aim to extract them.
The first type of features we use are the “shallow text” features from [1], namely the text and link density. The intuition here is that content blocks have a higher text density and lower link density then non-content blocks since many non-content blocks consist of short snippets of words or are mainly anchor text.
The top panel in the following chart plots the text density of the web page, with each bar representing one block in the document. Content blocks are colored in red, with non-content blocks in blue. There are two distinct groups of content on this page: the main article and the four comments. In each case, the text density is generally larger then the surrounding blocks.
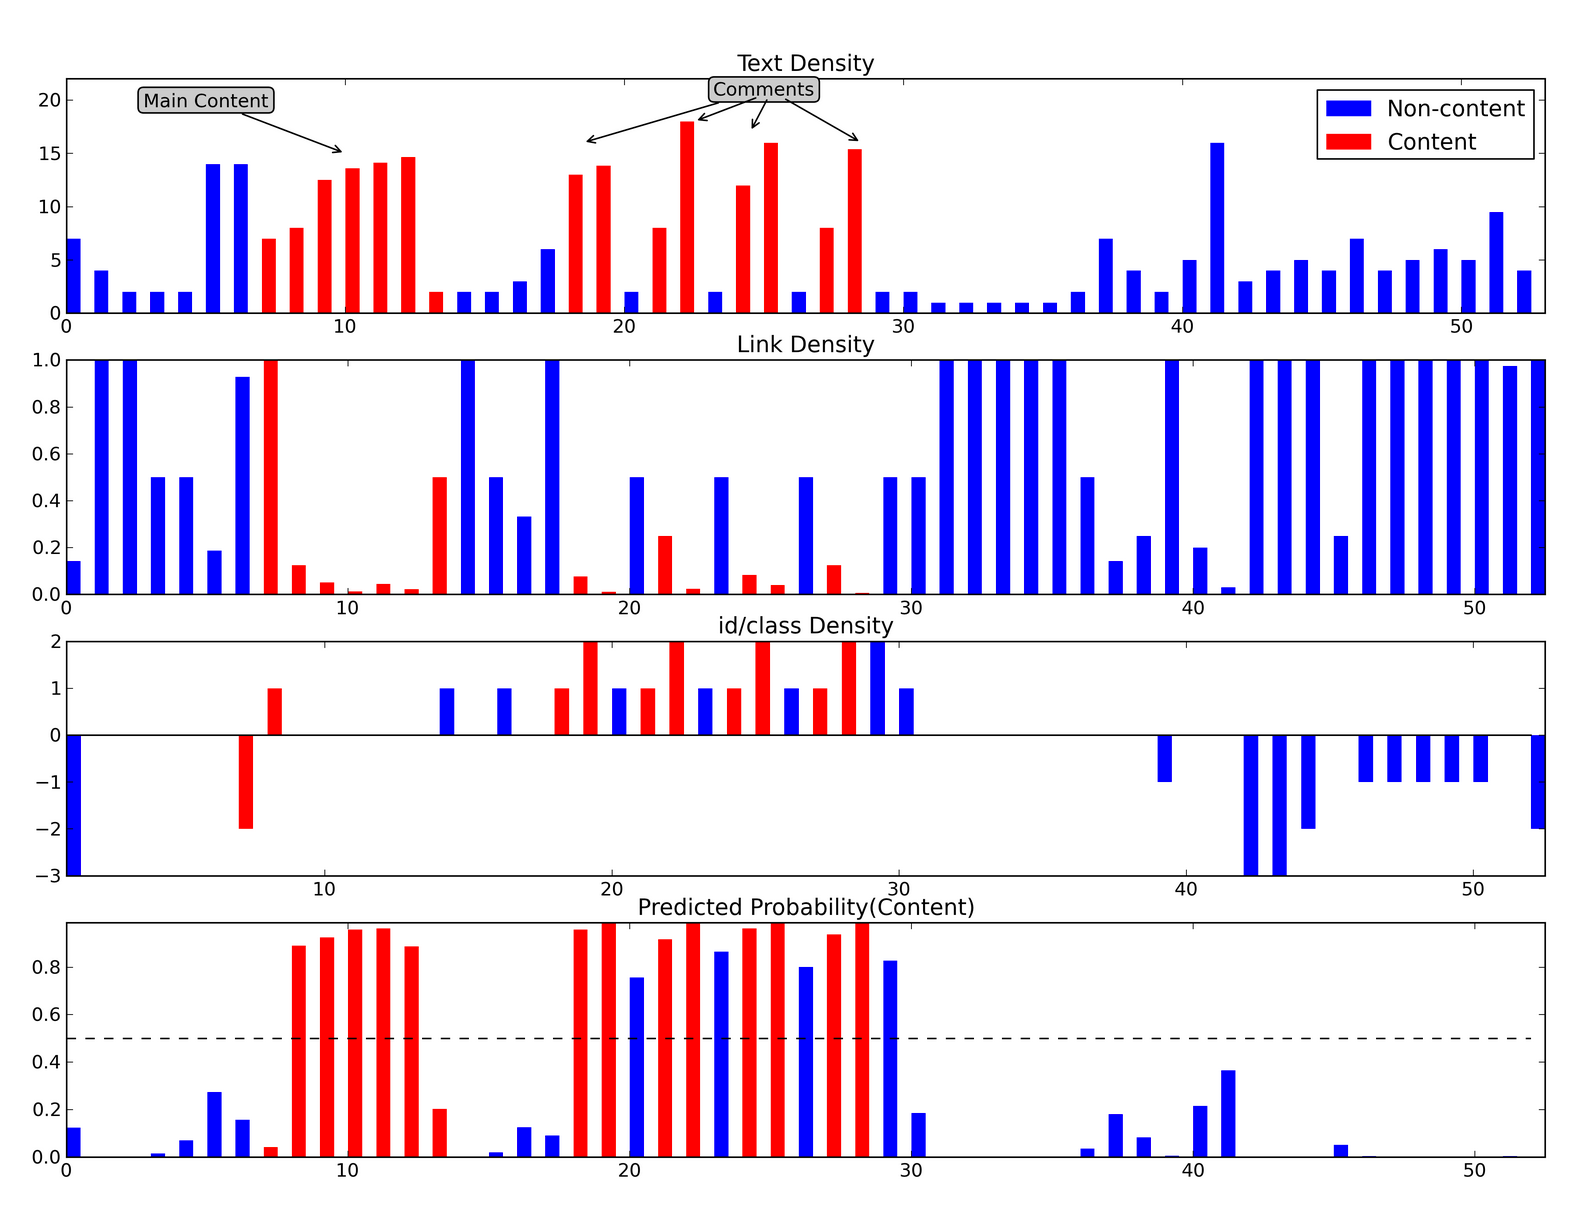
The second panel plots the corresponding link density. Many of the non-content blocks have a link density near 1.0 (all anchor text) with content blocks generally having lower link density.
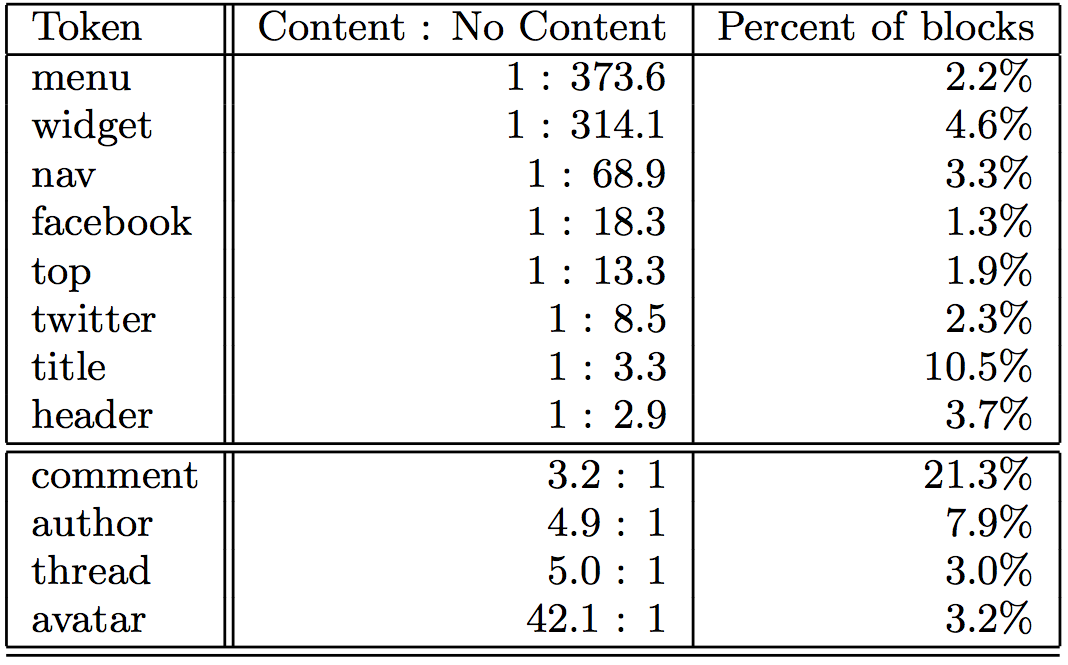
The second type of features we include are heuristically designed to capture semantic information in the HTML code left behind by programmers. Empirically we note that many of the id and class attributes in modern HTML tags include tokens
such as “comment”, “header”, and “nav”. These descriptive names are used by
programmers when writing CSS and Javascript and since they are chosen to be meaningful to the programmer, they embed some semantic information about the block’s content. The following table lists a few selected tokens in the class attribute along with their content to no-content odds ratios.
Tokens in the upper portion of the table are more likely to occur in non-content blocks, while those in the bottom are more likely to occur in content blocks.
Practically, each token is encoded as a 0-1 feature. To visualize these, we split them into two groups whether they are associated with non-content or content blocks (based on the odds ratio), flip the sign of the non-content tokens, and sum the binary features. This “id/class density” is plotted in the third panel in the chart above. Positive/negative values are generally associated with content/non-content blocks.
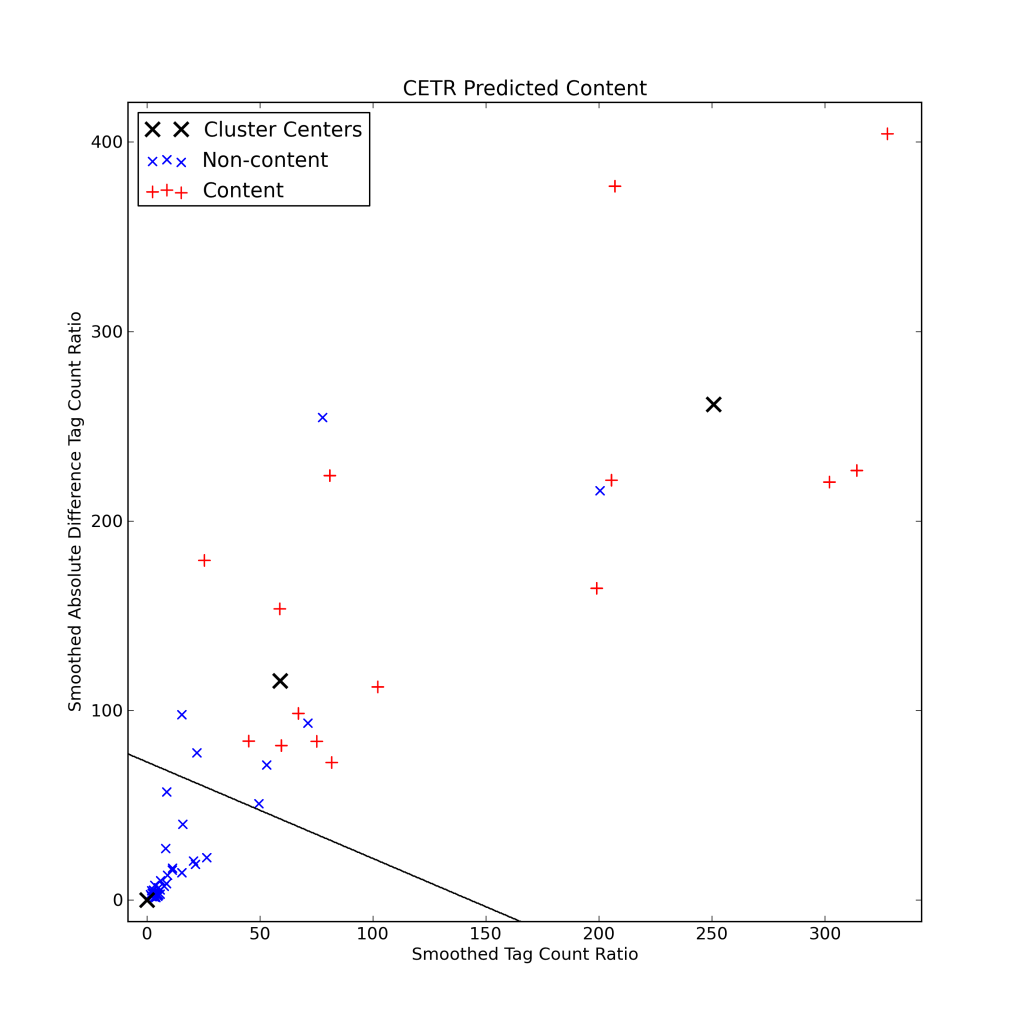
The third set of features we include are motivated by [2], which includes a few interesting ideas. First, the ratio of text length to the number of HTML tags tends to be higher in content blocks. Second, non-content sections of the page tend to be grouped together and have similar content-tag ratios, so that the difference in content-tag ratio from block to block tends to be small in non-content regions. The final idea is to combine the content-tag ratio and difference in content-tag ratio in an unsupervised k-means clustering approach, so that the non-content blocks naturally are clustered near the origin. The following chart uses this approach to visualize the page. The line separates the content from non-content blocks. Non-content blocks are to the left of the line (in the cluster centered at the origin) with the remaining blocks content (the remaining clusters).
Finally, the bottom panel in the first plot shows the model predicted probability of content, with a 0.5 cutoff illustrated by the dashed line. For this page the model does a decent job at extracting the true content. However, it struggles with the navigation blocks separating the comments and with the high link density blocks at the beginning/end of the main article.
Overall, performance increases as features are added to the ensemble:
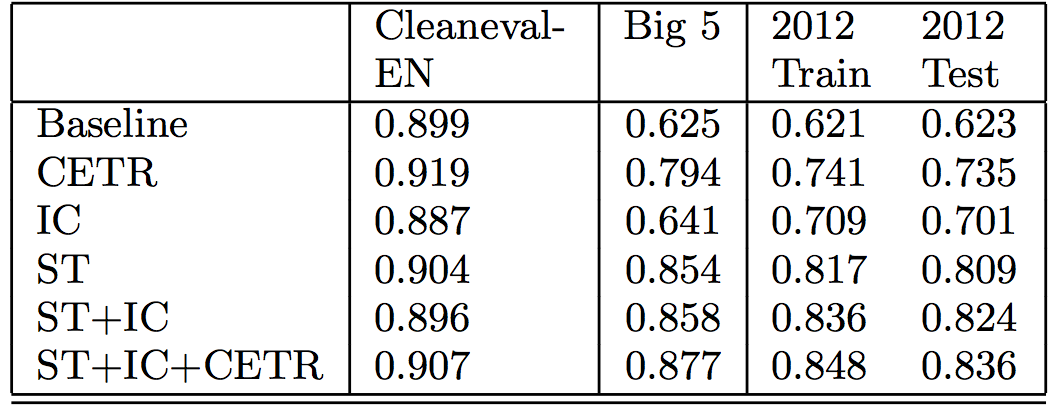
The table compares the token level F1 score across a variety of data sets, including two from previous studies (Cleaneval-EN and Big 5) and our own data from late 2012. It includes different feature combinations, including the shallow text (ST), id/class (IC), and content-tag ratio (CETR) features.
[1] C. Kohlschütter, P. Fankhauser, and W. Nejdl. Boilerplate detection using shallow text features. In Proceedings of WSDM ’10, pages 441–450. ACM, 2010.
[2] T. Weninger, W. H. Hsu, and J. Han. CETR: content extraction via tag ratios. In Proceedings of WWW ’10, pages 971–980. ACM, 2010.
Note: this article was originally published on the Moz devblog.